Milestones and project status
Add milestones and phases, see each one's health against your tolerance, and write the highlight report that records the project's RAG.
Updated 19 October 2026
Every project has a Plan. Unless you choose a fuller plan, it is a list of milestones, grouped into phases if you like. Each milestone shows its health — on track, at risk, late or done — worked out from its date, how complete it is and the project's tolerance.
Add a milestone
- Open the project. In the left navigation, under Project Management, choose Plan.
- On the Milestones tab, choose Add milestone. To group milestones, add a phase first with Add phase.
- Type the Title and choose the Date.
- Choose the Phase, the Owner and the Status, and set % complete if work has started.
- Choose Add milestone. The window stays open for the next one; choose Close when you have finished.
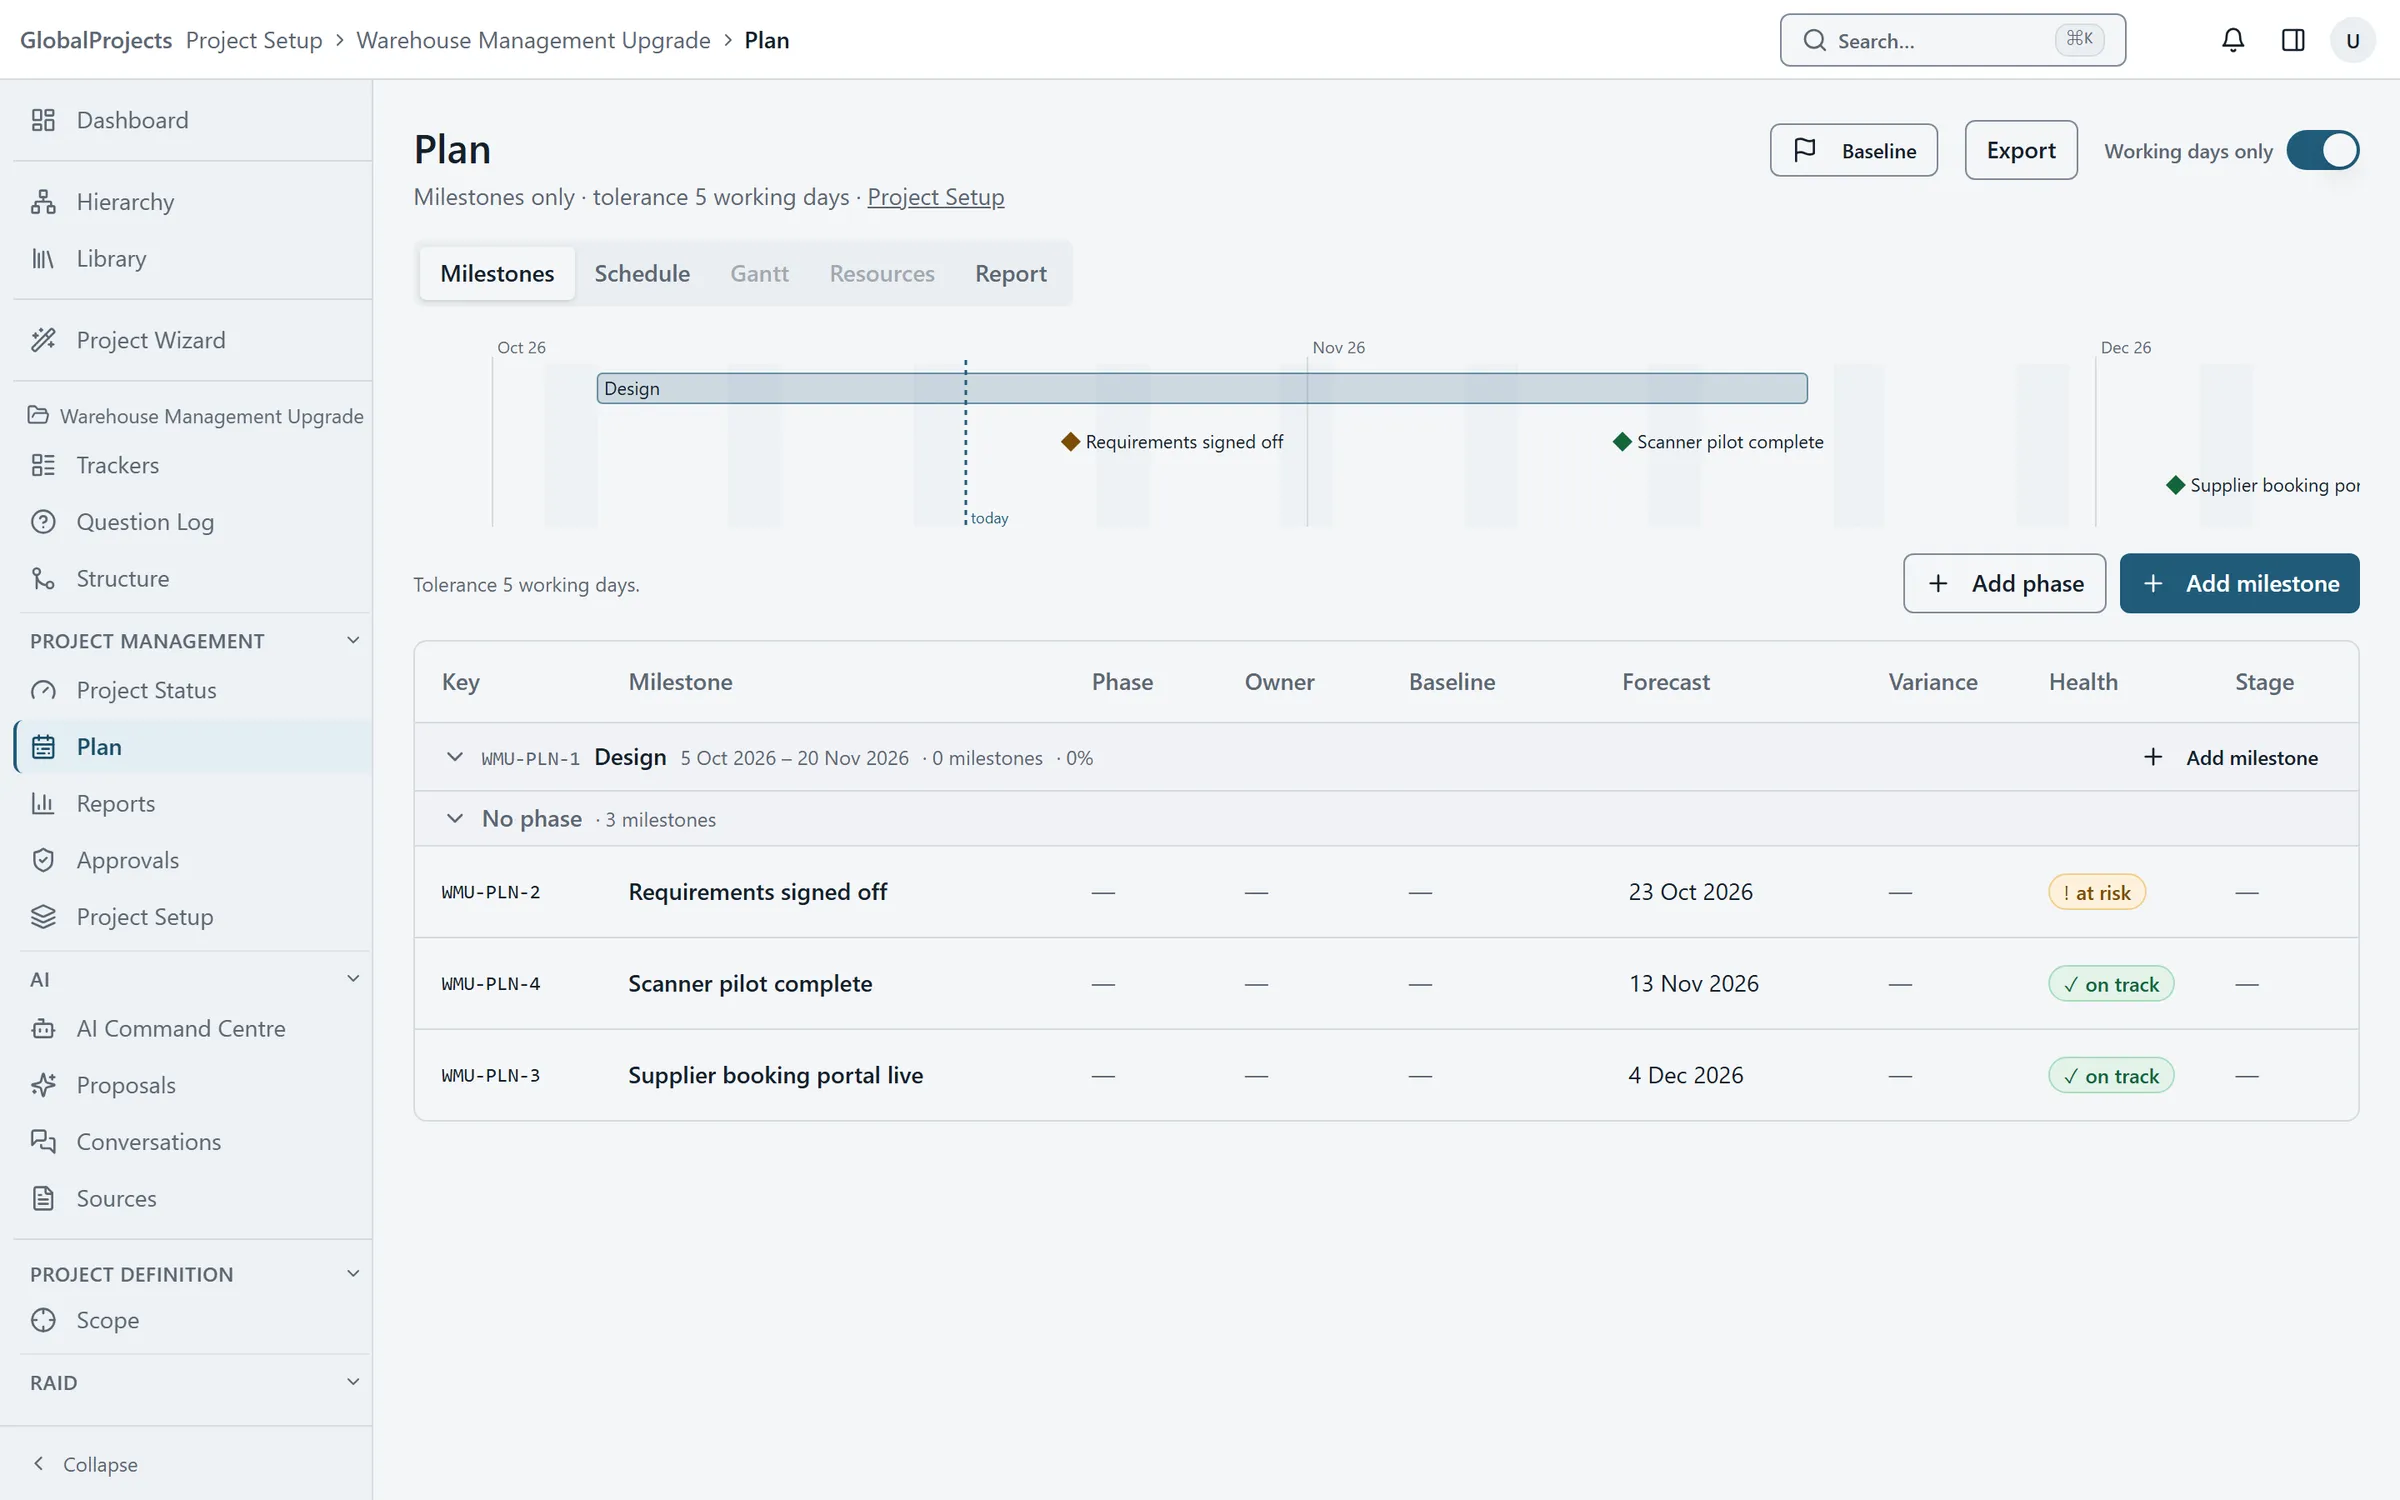
Move a forecast date
- In the milestones table, click the date in the Forecast column.
- Choose the new date and press Enter. Press Esc to cancel.
- Read the Variance and Health columns, which update straight away.
Write and publish the highlight report
- On the Plan page, choose the Report tab.
- Set the Period from and Period to dates.
- Under RAG, choose Green, Amber or Red for Overall, and for Schedule, Scope, Risk and Resources if you want.
- Write the Summary, Achieved this period, Planned next period and Decisions needed. A line starting with a dash becomes a bullet.
- Choose Save draft to come back to it, or Publish to issue it as a new version.
How health is worked out
- done — the milestone’s status is Done, or it is 100% complete.
- at risk — it is due within the tolerance and not complete, or its forecast is past its baseline by no more than the tolerance.
- late — its date has passed and it is not done, or its forecast is past its baseline by more than the tolerance.
- on track — anything else, including a milestone with no date.
The tolerance is set in Project Setup, on the General tab, under Plan, as Tolerance (working days). It is 5 unless you change it. The Working days only switch on the Plan page decides whether weekends count.
The computed hint and your RAG
Beside the highlight report, the Computed hint says what the plan suggests, such as “Amber suggested”. It is only a suggestion: the project’s RAG is a person’s judgement. Both are stored when you publish, so a reader can see what the data said at the time.
Published versions cannot be edited. Publishing again creates a new version.
On Project Status and the dashboard
Project Status has a When section with the timeline, the next milestone and the latest published RAG. The project dashboard shows a Next Milestone tile.
Who can change the plan
Adding and changing milestones and writing the highlight report need the manage plan permission, which the Project Owner and Project Manager roles have. Publishing needs generate reports. Everyone on the project can read the plan.
Related articles
- The schedule and the Gantt chart
Switch a project to a full schedule, build the work breakdown with durations and dependencies, paste tasks from Excel, and reschedule on the Gantt chart.
- Baselines, variance and resources
Take a baseline of the plan so you can see how far dates have moved, and add the people doing the work to see who is over-allocated.
- Project stages and gates
See which stage a project is in and what it needs before it can move on, advance it, move it back, or reject a stage with a recorded reason.